
Building an interactive web application to empower people with loan debt to pay off loans early
At long last, I am publishing a blog on my longest running side project to date - a web application built usng R’s Shiny that allows anyone with multiple amortized loans such as student loans or mortgages to determine exactly how much time and money they could save by making overpayments. I describe how the application works, the technical challenges encountered, and a discussion of the implementation details, including code documentation.
Introduction
In Spring 2018, I noted on my taxes that I had paid over $2,000 in interest on my student loans in the year 2017. Given that I was paying around $400/month for my loans, it seems like entirely too much was going towards interest and not towards paying down my balance. My heart sank. How was I ever going to pay these off if only $0.50 of every dollar I put towards my loans went towards paying down my balance?
Having been told that “overpaying could make a big difference” and finally being in a stable enough financial situation that I had started making small overpayments, I wanted to know exactly how that extra money would help me meet my goal of paying off my student loan debt by age 30. So I started crunching the numbers. Unfortunately, I had 5 loans which did not make this process simple. What first began as some simple back-of-the-envelope calculations quickly turned into a full blown web-application that I felt could be useful to a large percentage of the American population.
I also felt that no tool yet existed anywhere that provided someone with multiple loans a way to plan for making overpayments and see just exactly what their payments will look like, when each loan will be paid off, and how much time and money they will save in the long run. After all, the loan providers certainly have no desire to educate their lendees on this and there is no particular way for a third-party to make money providing this tool. My only intention in creating this application - outside of understanding my own loans - is to educate others and empower them to get out of debt sooner in a way that is in their budget.
How to Use the App
If you follow this link, you will land on the site where I host the loans calculator. Keep in mind that this loans calculator only works for amortized loans, or loans with a fixed payment schedule and period such as student loans, car loans, and mortgage payments. This does not apply to revolving debt such as credit card or medical debt. This also does not apply to loans with prepayment penalties or which have a fixed “finance fee” which is often written in the fine print of the loan terms - meaning the total interest is calculated from the beginning and you are not able to pay less over time by overpaying on your loans. Last I checked, SoFi was one of these lenders and I am saddened how many people refinance with them despite how limiting it can be to take out this kind of loan.
If you would like to input your loan information, follow the steps below:
- Specify how many loans you have.
- Expand each accordion, and fill out the four necessary fields:
- Name: The name of your loan provider or specific loan name. This will make for more useful graphics than keeping the labels “Loan 1”, “Loan 2”, etc.
- Remaining balance ($): The current balance on your loan, including interest accumulated since your last payment. This should be easy to obtain on your loan lender’s website.
- Minimum monthly payment ($): The monthly payment established as part of the terms of your loan. This is most likely what you have been paying each month unless you are under a special repayment program such as income-based repayment.
- Interest rate (%): Specified as a percent, e.g. 5 for 5% interest, this is the interest rate on your loan. The calculator assumes this is a fixed interest rate. For variable interest loans, all results given by the calculator will only be approximate. This should also be available on your loan lender’s website but might take a bit of hunting under the specific loan details.
Overview Tab
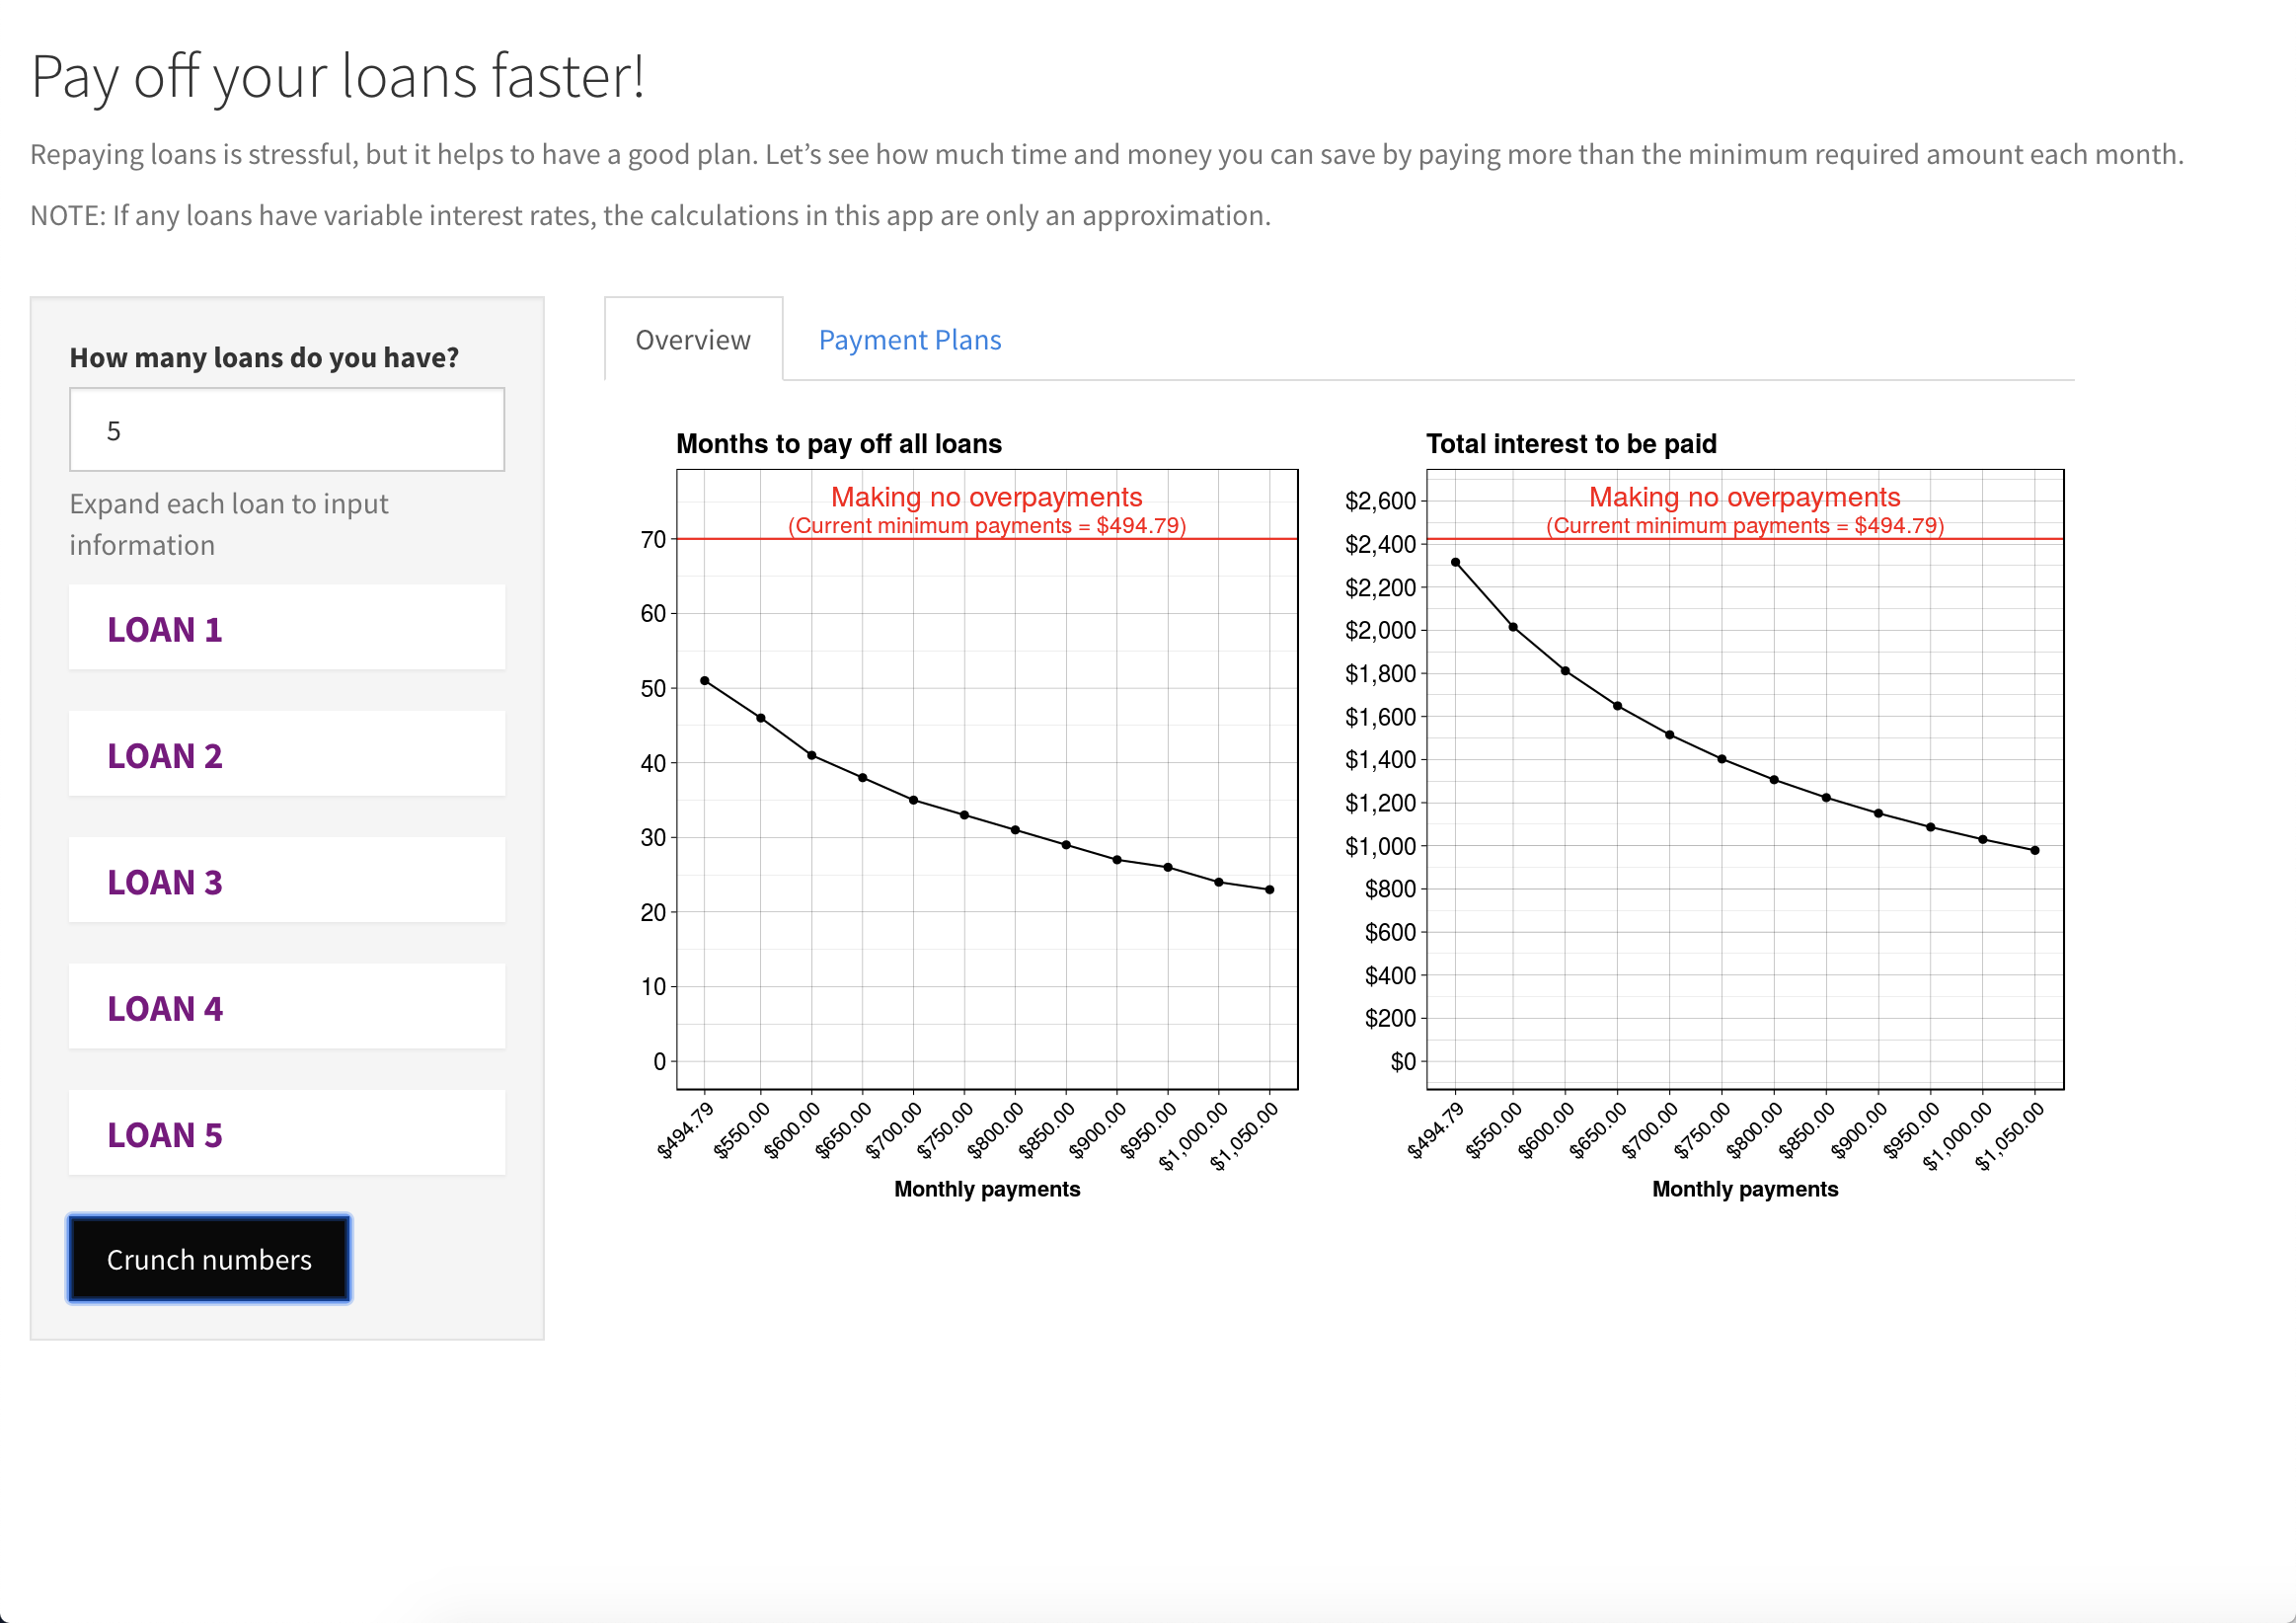
Once all your loan information is filled out, repayment options are calculated and results are initially summarized in two graphs in the Overview tab. Each graph has the potential total monthly payments across all loans shown on the x-axis, up to $500 in overpayments above and beyond the total minimum monthly payments. The first graph shows how many months it will take to pay off all loans and the second graph shows how much interest will be paid over the life of all loans for each monthly contribution.
The time and interest for only making the minimum monthly payments are also plotted in red. These may differ from the first data point if any particular loan will be paid off before another as the red line calculation assumes you will start making a new, lower total monthly payment once a given loan is paid off instead of maintaining the payment amount from previous months by overpaying on the next highest interest loan. If this is confusing, it should become more clear in the Payment Plans tab of the app.
Payment Plans tab
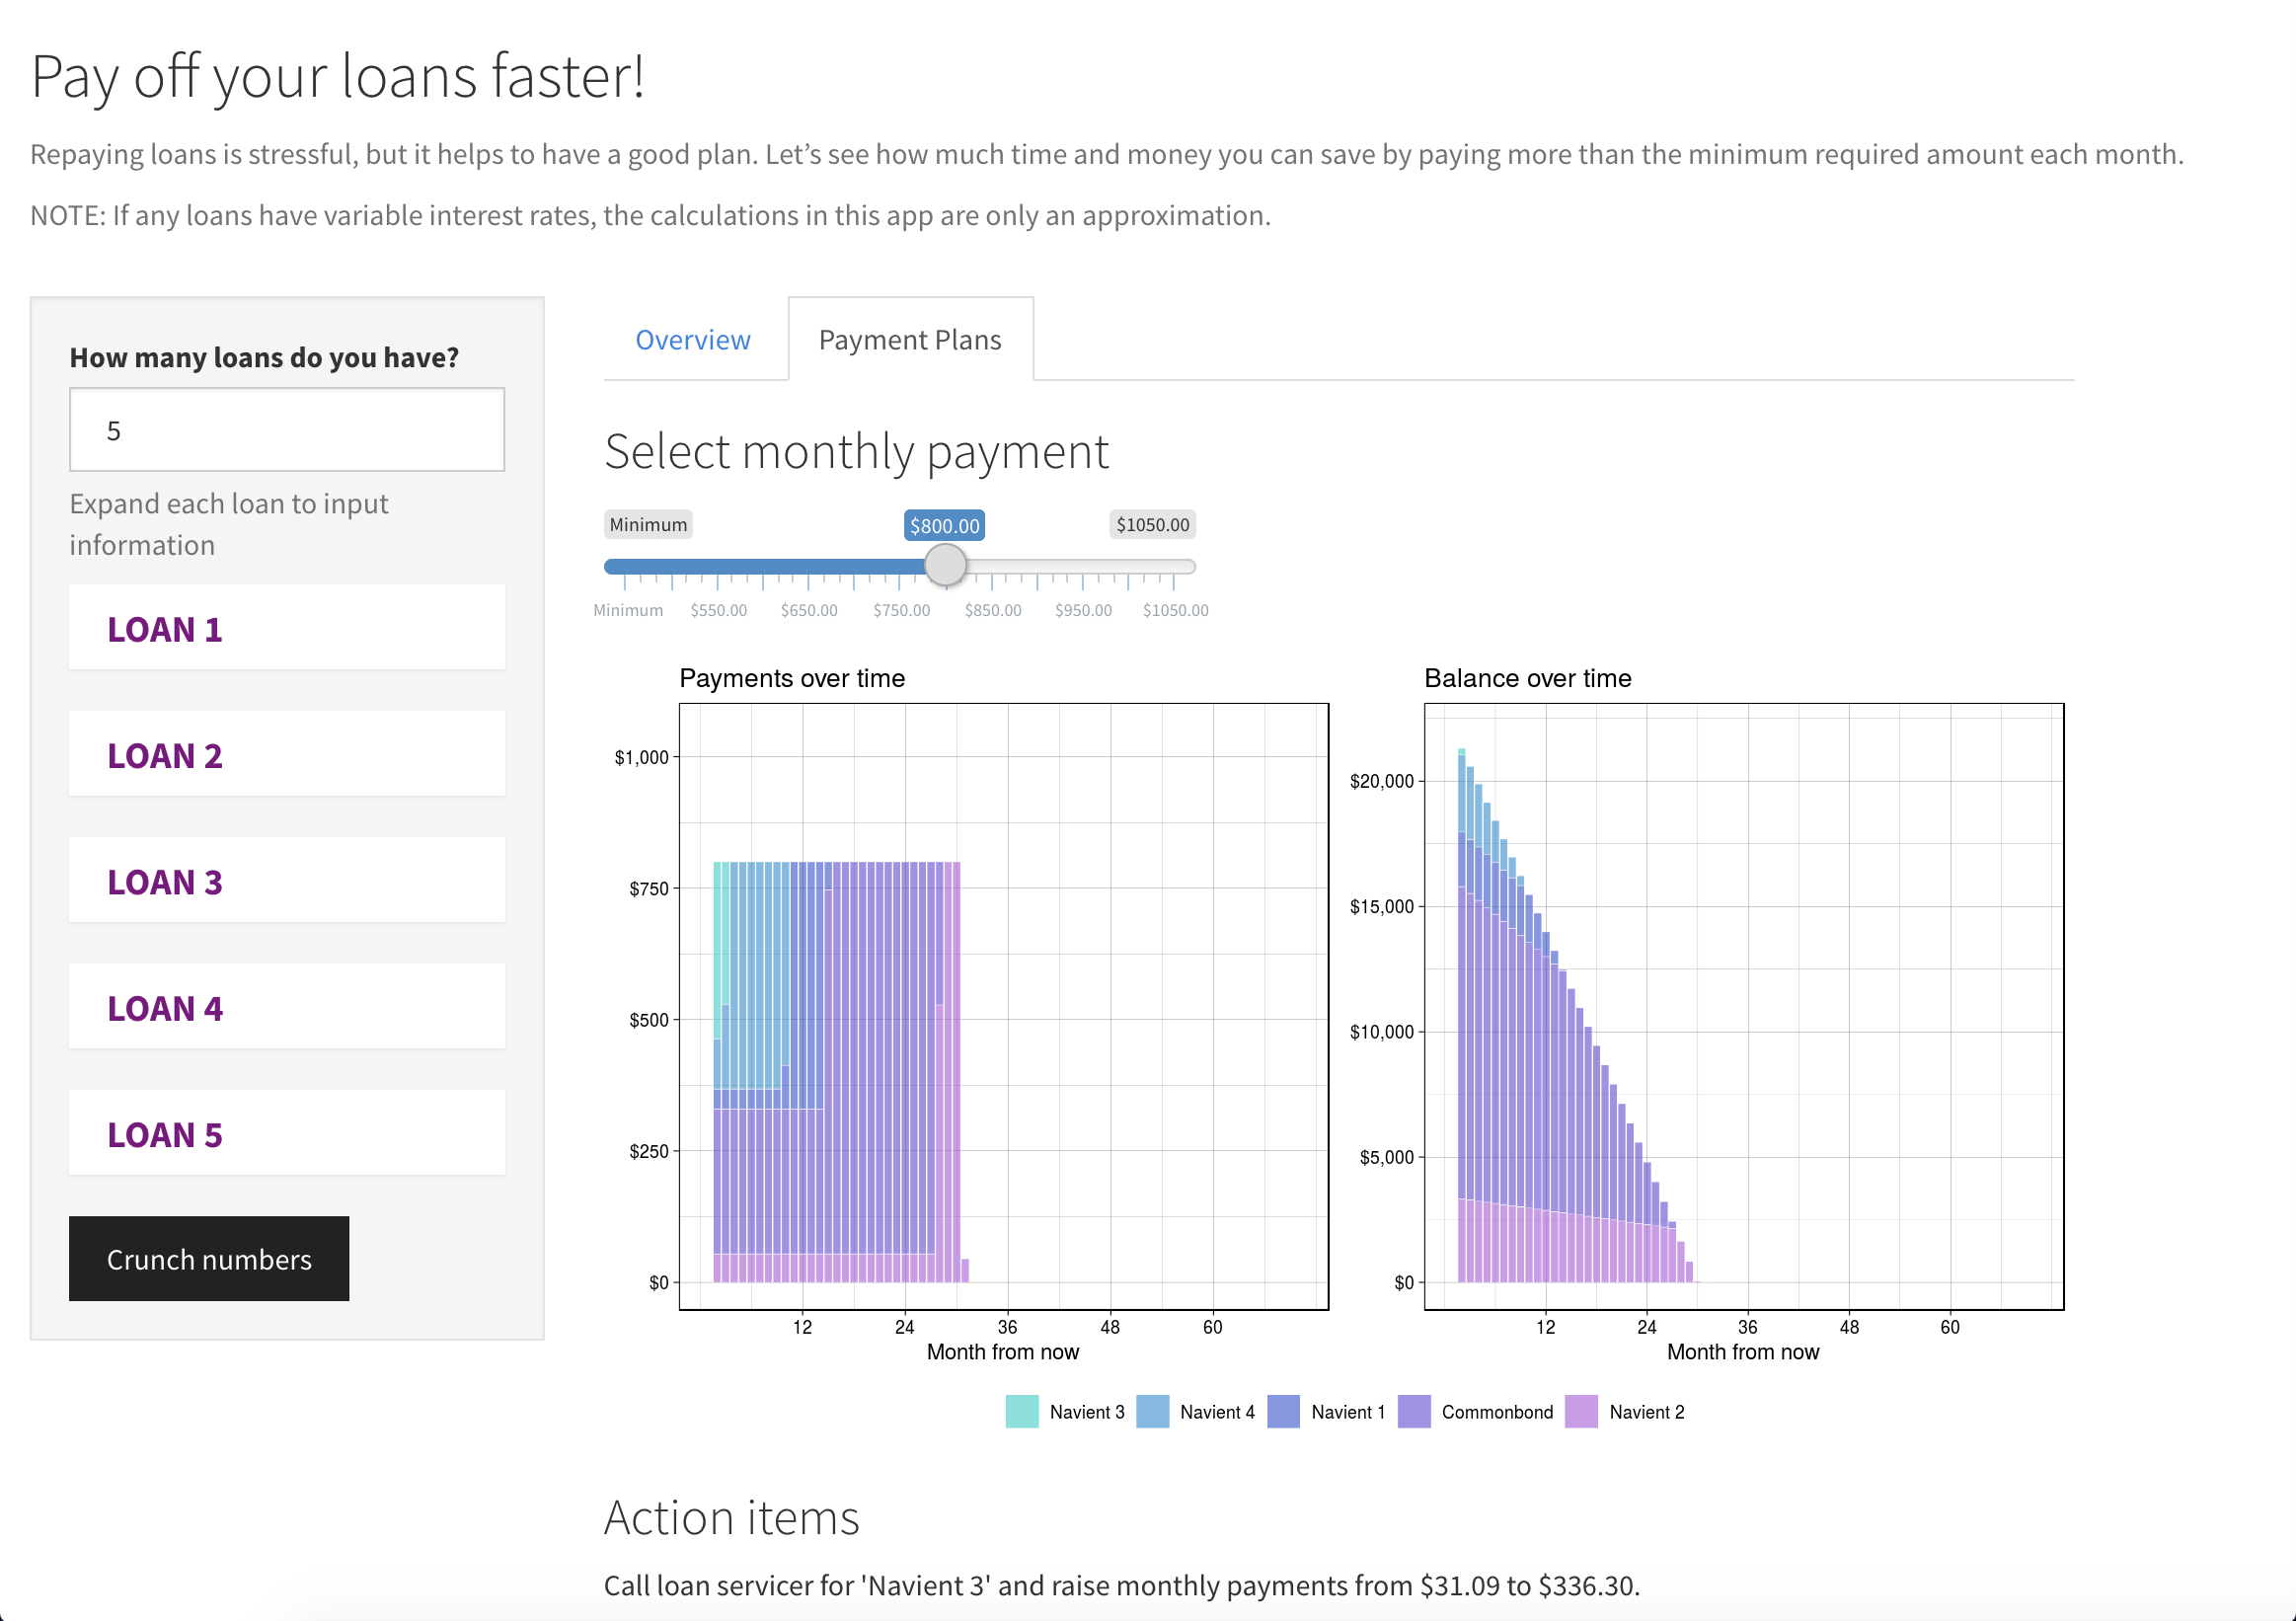
The Overview tab is great to answer the question “how much of a difference will an extra $X dollars make on the time to pay off my loans and total interest paid?” If you are looking for more detail, it is the Payment Plans tab that will allow you to answer the following questions:
- If I pay $X dollars per month, what will my actual loan payments look like?
- What will my balance look like in $Y years?
- Which loan do I overpay on first and when can I expect each loan to get paid off?
The visualizations in this section show the payments and balance over time per loan as stacked bar plots. You can see from any level of overpayment above the minimum that the specified monthly payment will be maintained even as loans get paid off. This may result in a plan that has you paying off a loan in the same month that you start overpaying on another loan in order to maintain a constant monthly payment.
Of course, loan providers do not make it easy to increase your monthly payments easily over their website, so you will likely need to call the loan providers and ask them to increase your auto-pay payments to the amount specified under the Action Items section of the Payment Plans tab. If you are like me, the person on the phone will encourage you against this because “you will be stuck paying this until you call back to change it”. They might also act like it is a strange request and put you on hold for a while. You could also potentially set up your own auto-payments for the overpayments through your bank if this is easier (though keep auto-pay for the minimum payments as there is usually a small interest rate discount for having this set up).
Financial details
I anticipate most people will be satisfied with reading this blog post through the previous section on how to use the app. For those who are curious about the math, continue on as in this section I will be talking about how the numbers are calculated under the hood.
One of the most challenging aspects of building this app was determining how to properly keep track of payment schedules for each level of overpayment.
For each loan, the app asks for minimum monthly payment, remaining balance, and annual interest rate as all of these values are required to determine loan schedules. In a given month for a single loan, it is relatively straightforward to calculate the amount of a specified payment (either minimum payment or including additional overpayment) that is directed towards paying down the principle and how much is directed towards interest given the remaining balance of the loan.
We first calculate the amount of interest as below:
interest_payment = remaining_balance*annual_interest/12
Then, the remaining amount of the payment goes directly to principle:
principle_payment = monthly_payment - interest_payment
Overtime, the interest payment will decrease for the same amount of monthly payment as the loan balance decreases. To determine the remaining payment schedule of a single loan, you would simply iterate through each month, determining the new loan balance each month and feeding that as the remaining balance for the next month using the simple formula:
remaining_balance_new = remaining_balance_old - principle_payment
What makes this application novel is that it accounts for multiple simultaneous loans. This introduces several challenges:
- What order to pay off the loans
- Maintaining a fixed monthly payment amount even as loans are getting paid off.
The first bullet point is easy: overpay on the loans in descending order of interest rate. Without a doubt, this will result in the least amount of interest paid over the life of all loans. Some people recommend the “snowball method” of paying off loans - overpaying on the loans with the smallest balance first - as you will payoff some loans sooner which will keep you more motivated to keep overpaying. So perhaps if you are highly motivated by emotions and a sense of accomplishment, this is a better strategy, but mathematically speaking, it is not advisable.
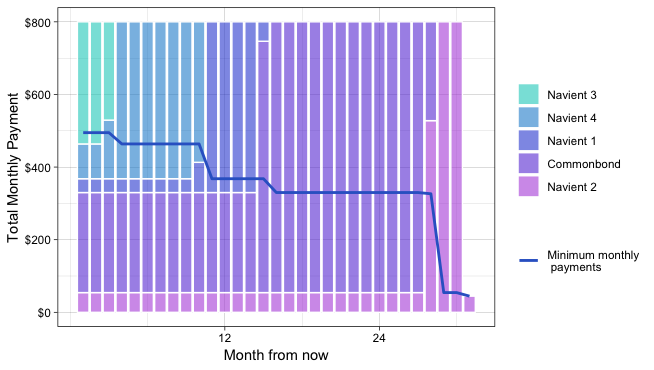
The second bullet point was easily the biggest headache for me when building the loan repayment schedules for this app. If we look at the following loan repayment schedule from my loans, we can see that in month three, the loan called “Navient 3” gets paid off, but it requires less payment than the months before to get the loan balance down to $0. So to keep the monthly payment at $800 even, we have to start overpaying a small amount on loan “Navient 4”. We see a similar pattern throughout the payment schedule as each loan gets paid off.
To handle this scenario is a bit of extra work by considering the next loan in line each month to be ready to allot overpayments to it properly. But consider the scenarios where multiple loans may get paid off at once and you have to go to the third loan in line to designate overpayments. Or perhaps a shorter-term loan that is not being overpaid gets paid off while overpaying on a different loan. Because any of these scenarios could arise with any frequency, I had to get creative as I kept track of payment schedules. I accomplished this by:
-
Calculating the monthly payments for the non-overpayment loans first. Here I can determine if any loans get paid off during typical payment schedules and can allot any leftover money to the loan(s) being overpaid.
-
If the current loan being overpaid gets paid off with leftover money for the month, loop through the next loans in line to be overpaid and apply as much overpayment as possible to each loan up to the amount of the leftover payment.
These details are probably not terribly interesting but I wanted to share in case anyone was interested in how difficult of a problem this was to solve! I will say one of the coolest things I learned while doing this app is that even if you don’t ever pay any more than you pay today on your loans but you maintain the same monthly payment until all loans are paid off instead of paying less and less as each loan gets paid off, you can save yourself a lot of time and money.
Implementation details
This application was created using RStudio’s Shiny package for creating interactive web applications. I had built several Shiny apps in the past, but this one was by far the most difficult, largely because I cared a lot about user interface and experience for this application.
Throughout this section on implementation details, I will discuss the following code which can all be found in my Github repo: * Source code for doing calculations, generating data frames, and using that data to generate plots (source.R) * The shiny server and UI code (app.R)
Source code
This code lives here and is used for all the behind the scenes calculations and plot generations that are used by the shiny app.
calc_mo_pay
This simple functions takes the balance, interest rate, and payment applied to a loan (could be an overpayment) and determines how much of the payment goes to interest and how much to principle. It returns a one row data frame with these values and the new loan balance.
conduct_schedule_analysis
This function is where all the magic happens of calculating the payment
schedules for all loans in loan_info_list given a specified total
monthly payment across all loans. The function works through the
following steps:
-
Determine which order to overpay on loans by sorting by interest rate in descending order. For multiple loans with the same interest rates, overpay on the lower balance loan first, `{a} la the snowball method.
-
For every month until all loans are paid off:
- Determine the current
overpay_loan, the highest interest remaining loan. - For all the loans remaining that are not
overpay_loan, calculate each loan’s monthly payments using the specified minimum monthly payments. - Once it’s determined how much of the allotment is going towards minimum monthly payments, determine the remaining payment amount to be allotted to the loan being overpaid.
- If
overpay_loangets paid off and there is still leftover money for that month, apply it to the next loan in line, continuing this process until the specified monthly payment has been achieved. - Return a data frame with all monthly payments for each loan.
- Determine the current
Of course, the function keeps track of any mathematically invalid entries (e.g. an interest rate that is too large to ever pay off the loan given the monthly payment) and returns an error to the user.
plot_payoff_options
This function is used to generate the plot displayed in the Overview
section of the app. It takes a data frame that consists of the data frames
from conduct_schedule_analysis for all payment options between the
minimum monthly payment up to $500 in overpayments (in increments of
$50). I used custom axis breaks and used the grid.arrange function
from the gridExtra library to combine the two plots.
plot_bar_one_option
I used custom colors and custom breakpoints because I did not like the
look of ggplot’s default values. I also used the grid.arrange as well
as the arrangeGrob function from the gridExtra library to combine
the two separate plots, as well as some hacking to get a common legend
between the two plots.
Application code
All Shiny applications expect an app.R file that contains a UI object
and a server function. This file lives
[here](here
and comes in at just under 300 lines of code to do all the work to build
the web application with the assistance of the source functions.
UI
The UI object is beautifully simple, consisting of maybe 20 lines and
using a the theme "cosmo" from the shinythemes library. It includes
the specification of the titlePanel and some helpText at the header
of the site, with a traditional sidebarLayout object consisting of a
sidebarPanel for inputs and a mainPanel for outputs.
The side bar only queues the user for how many loans they have and includes a submit button. Because the number of loans vary and because I wanted to use accordions, the code for adding the loan information input fields actually lives in the server, which we will discuss in the section below. Getting that part of the code right was a big headache and took a lot of my energy!
The main panel with all of the output information (the Overview and the
Payment Plans tab) is also quite simple, consisting of tabPanels with
plot and text output, but also a uiOutput for the slider bar in the
Payment Plans tab.
Server
As anyone who has worked with Shiny will know, building a functioning
server function is the trickiest part of getting a Shiny app to work.
This is where all of the functions in the source code are called and
where the output rendering for the UI takes place. It was especially
complicated in this case because of the necessity of insertUI and
renderUI which I had never used before, as well as the use of a
progress bar. I also had to be a lot more intentional about my
reactives, making sure I was using the right function among reactive,
eventReactive, observeEvent.
For this app, the server function takes the typically optional session
object so that I can insert the tabset panel in the main panel of the
app after all the loan information has been entered and the submit button is pressed.
Once the loan information has been input and submitted, I first call
removeUI to remove any UI previously inserted (if this is at least the
second time the submit button has been pressed). Then the list of UI
accordion fields for loan information is re-created. For each loan X:
- If loan X is a new loan (not previously entered), create a new blank field. If loan X has been entered before (even if the user has removed it since it was created), create the fields filled in with the previous inputs. This prevents the user from having to re-enter information if they regret reducing the number of loans and seem to ‘delete’ the information they had input.
- Create an accordion object for loan X using the
accordianItemfunction from theshinydashboardPluslibrary.
After the previous step, there is a list of accordion items that need to
be inserted into the UI. So the insertUI function is called and the
ui argument is fed using tags$div so that I could use do.call on
the accordion list to insert multiple accordions into a single UI.
Figuring this part out was likely the biggest headache of the entire
app.
Once the UI has been generated and the user has input all of their loan
information, the loan information is converted to a list. Then the
schedule data is generated for all the considered level of overpayments
in a large eventReactive function. After discovering that you can
break my app by entering unrealistic loan information (e.g. $50 payments
on a $20,000 loan at 10% interest will never be paid off), I included a
catch to send an error to the user using validate for when the loan
term is calculated to be infinite.
As it takes more than a few seconds to do the calculations across all
potential payment schedules, I use withProgress to include a progress
bar for when the data used for the plots in the Overview tab are being
generated. After all calculation are complete, the resulting data is
returned. Each potential repayment schedule is summarized by the total
months it requires to pay all the loans off and how much of your money
will go to interest instead of principle in that time. The plot of each
of these variables by monthly payment across all loans is plotted in the
Overview tab of the main panel.
Finally, render the slider bar for the Payment Plans tab using
renderUI. Once the user has changed the value on the slider bar,
render the bar plots and the “Action items” header and text.
Conclusion
I hope this blog post has been informative for all those interested in using the application to help them pay off their loans early as well as those curious about Shiny applications and all their intricacies.